Chief Investment Officer
We pride ourselves in our respect for the markets. We believe that price is truth and that you need to approach investment analysis with humility, or you risk being humbled by the complexity of the markets.
Our Risk Number® and corresponding six-month 95% Historical Range is a historical calculation using a variety of statistical inputs, based on the price history (expense ratios, dividends, etc.) at the holding level. This last statement bears repeating; we do not use the antique process of mapping holdings to a set of assumptions at an asset allocation level. Price, at the holding level, is truth. We derive our statistics from each holding’s actual price history because it’s more robust than an asset allocation mapping methodology.
The six-month 95% Historical Range is profound because humans make decisions in the short term. Great advisors couple the realities of investor psychology in the short term with the risk capacity discussion, powered by Retirement Maps, to marry both short term and long term probabilities decisions.
Even though our six-month 95% Historical Range is a historical calculation that does not explicitly say “here’s what is predicted to happen in the next six months,” we assume that humans may implicitly apply historical probabilities into the future. While we can all recite the phrase “Past Performance Is No Guarantee of Future Results,” we test our methodologies to inform best practices for those who implicitly use the past as an input for what to expect in the future.
To that end, we recently completed a detailed analysis of the top 250 holdings in Nitrogen to determine what percent of holdings would have broken out of the six-month 95% Historical Range if applied to the next 6-months. We shared the results of a similar accuracy test, at the portfolio level, in November of 2016. In both reviews, we were forced to look at only the worst markets, peak to trough in a 6-month time period, to even find a material number of holdings or portfolios that broke out of.
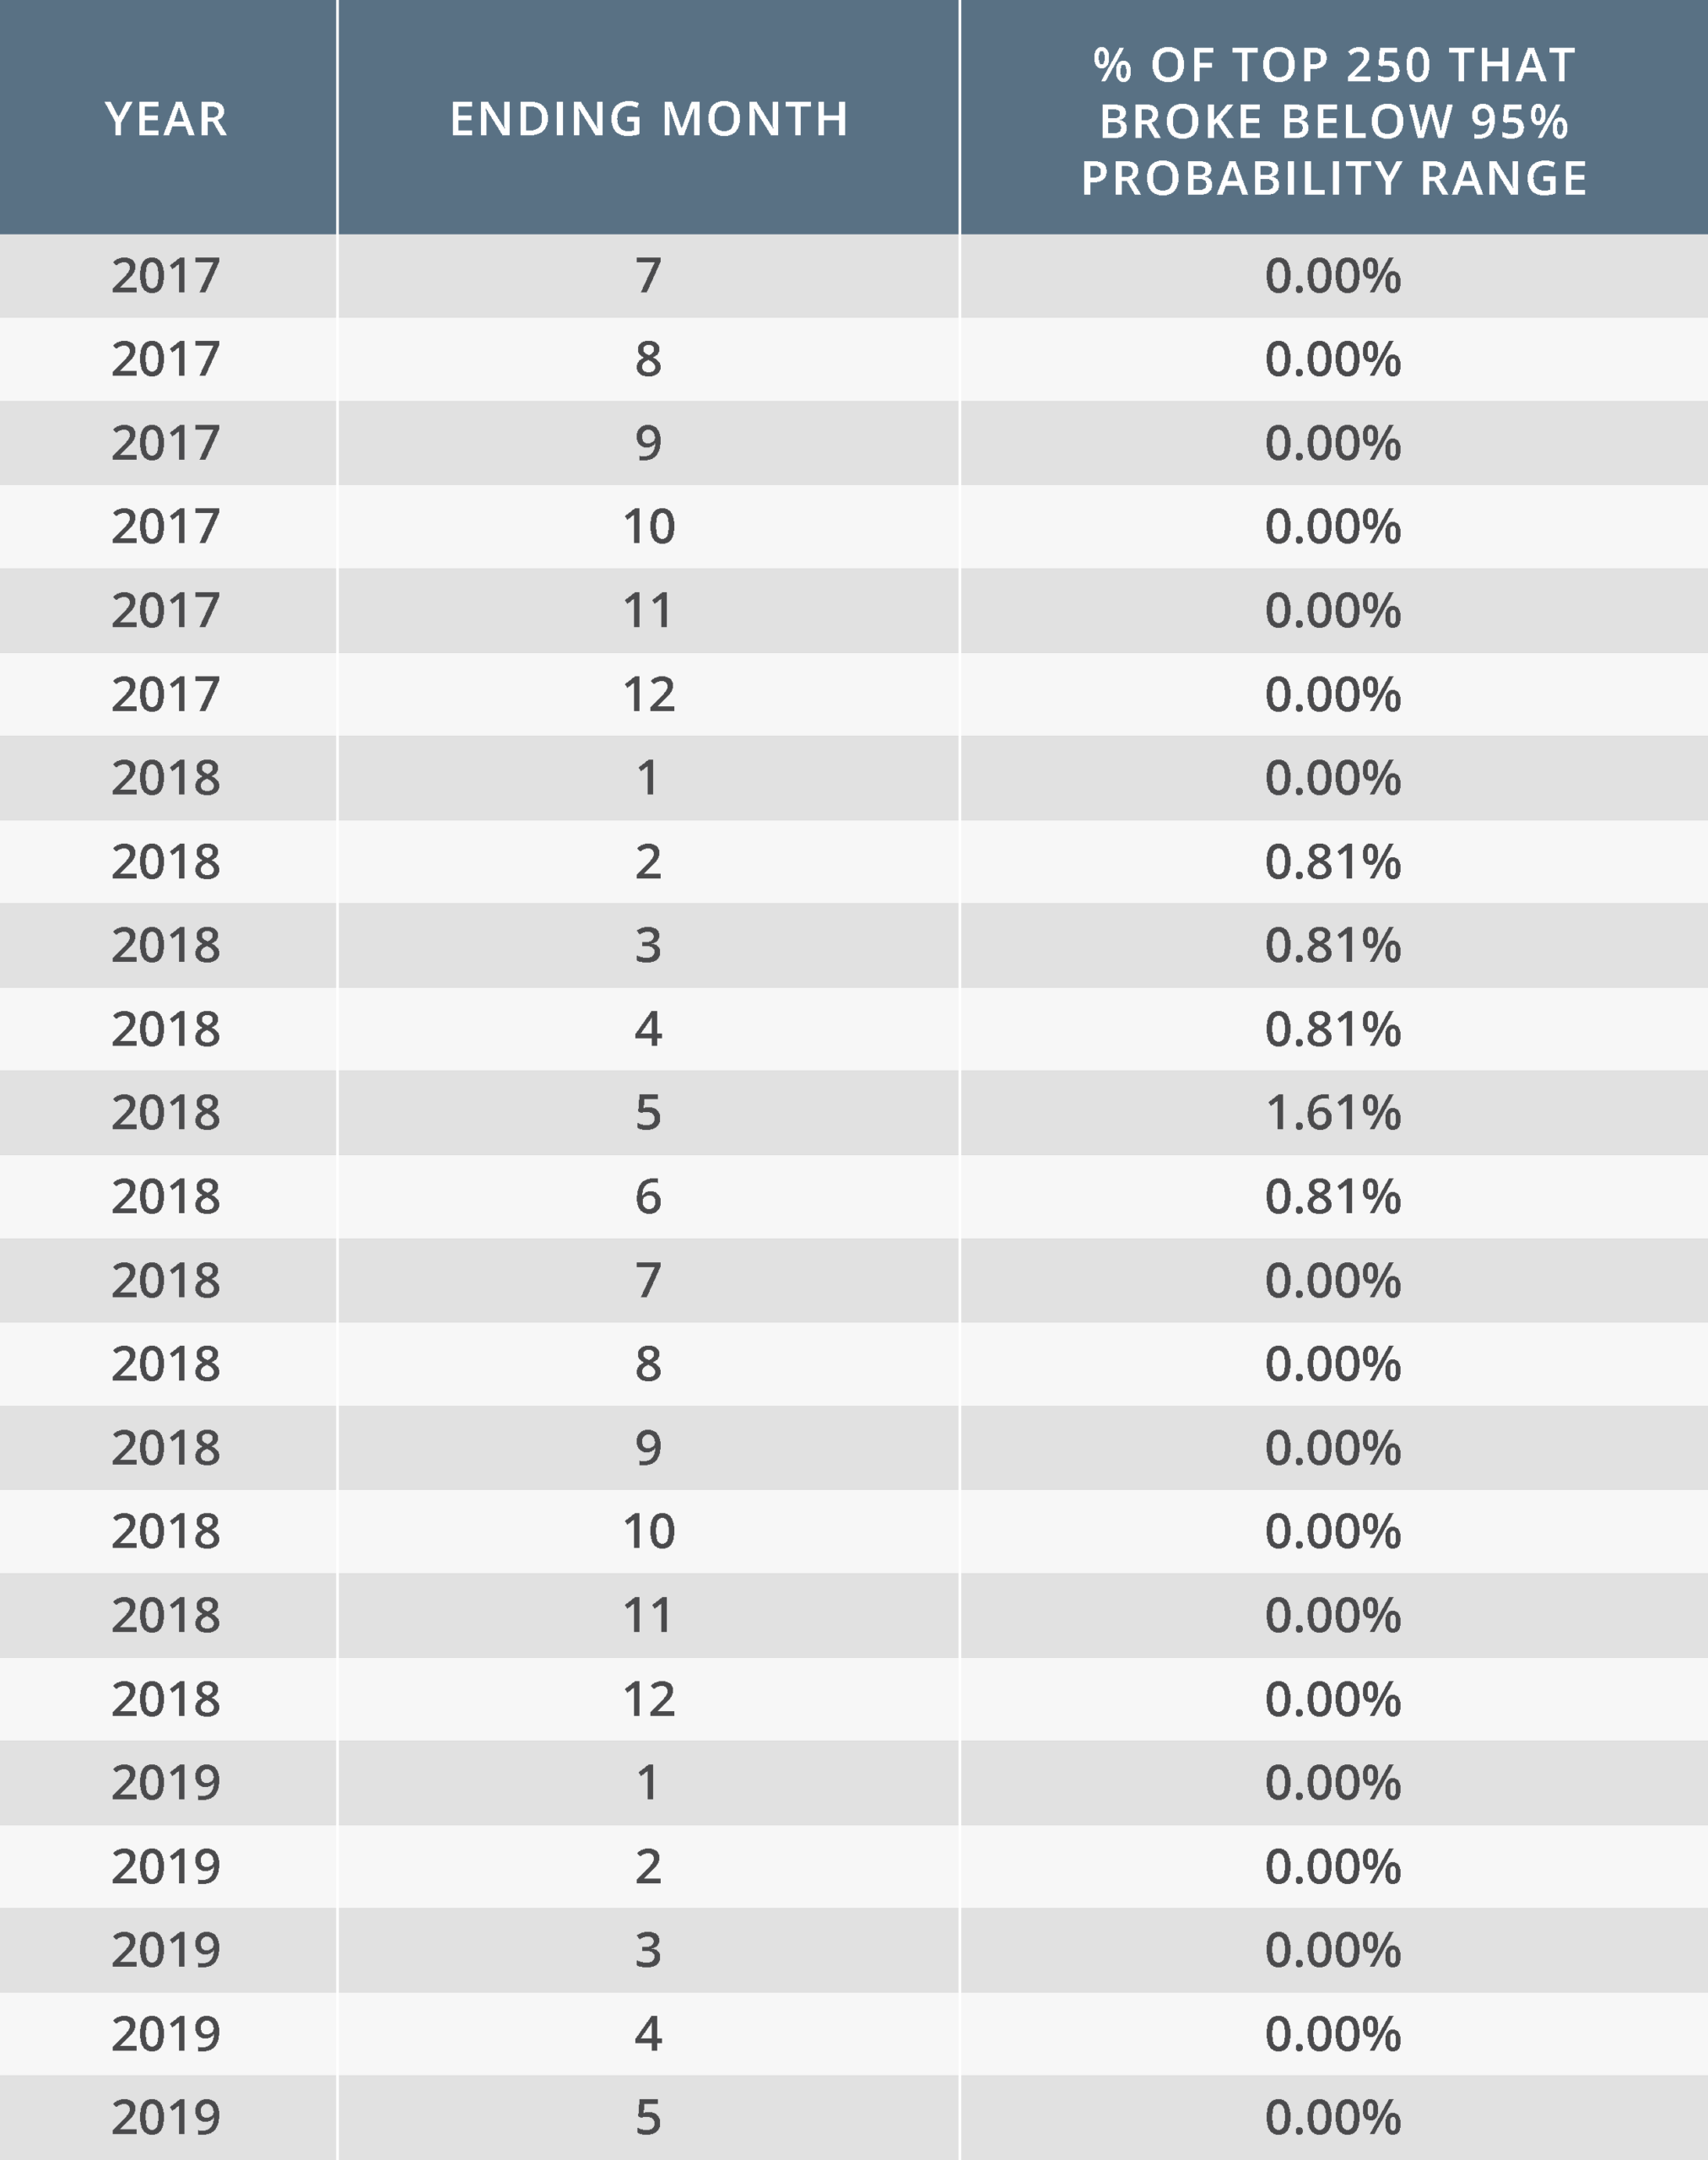
In this analysis, we calculated what percentage of the top 250 used securities in our system broke below the 95% Historical Range throughout each month. In the vast majority of cases, none of the 250 most widely used securities on our platform broke below the calculated 95% Historical Range, as shown by the “0” below.
The highest number of securities that broke below the calculated 95% Historical Range was 4 of 250 (1.6%); the 6-month periods between November 2017 and May 2018. That means that only 4 of the 250 most used securities on our platform fell below the calculated 95% Historical Range established throughout November 2017.