Nitrogen Elite
Nitrogen Ignite
Nitrogen Ultimate

Go to the source
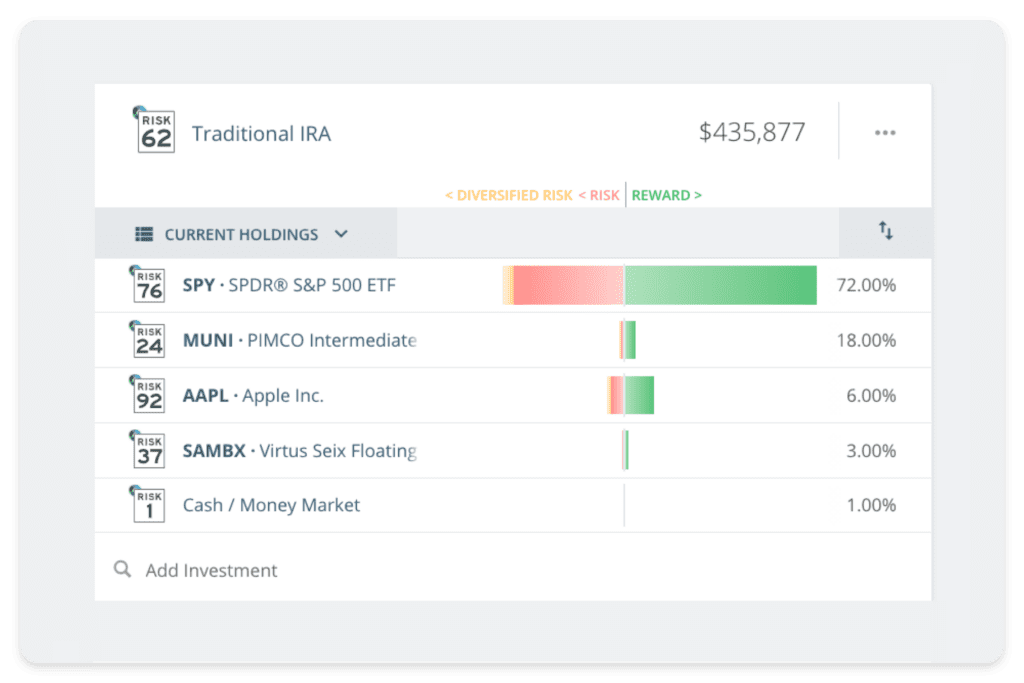
See the impact a sentimental stock or concentrated position has on a client’s portfolio. Risk is plotted on the heatmap in proportion to allocation, allowing you to show your clients an intuitive illustration about why you’ve made certain decisions together.
With one quick visual, you can see the performance, volatility, and correlation of each individual security within the content of your client’s total portfolio.

Visualize diversified risk
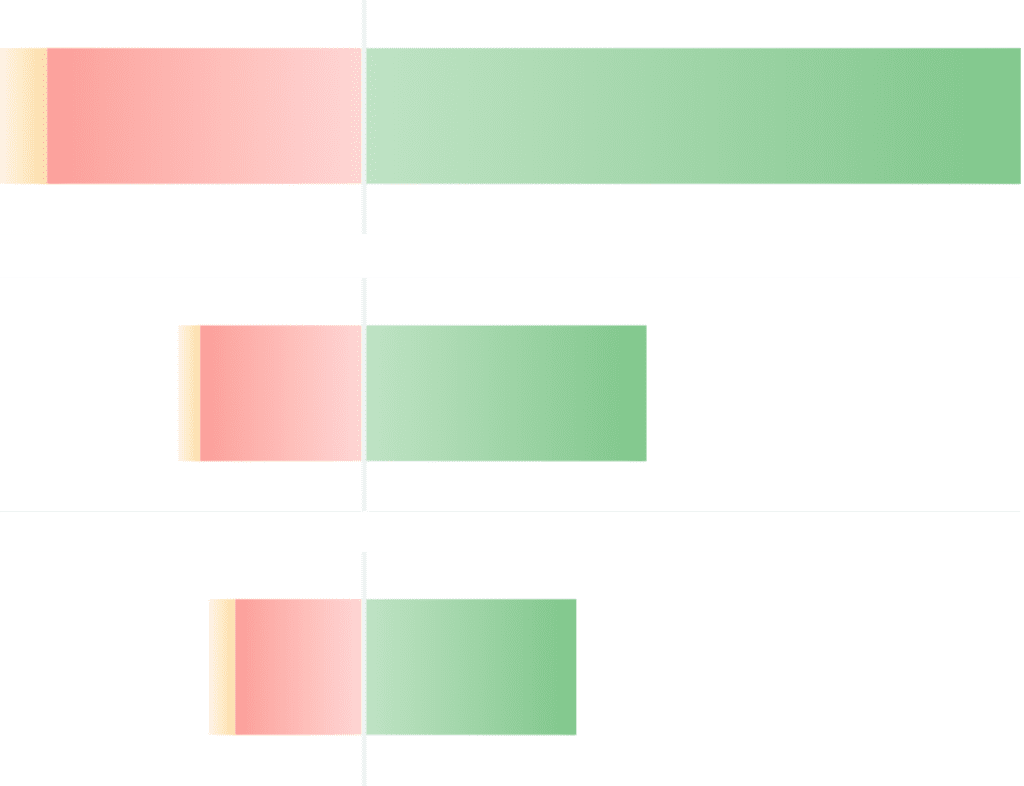
In addition to visualizing potential risk and potential return with a juxtaposed set of red and green bars, a gold bar helps you paint a picture of the amount of risk that is diversified out by inverse correlations given the selected data model.
Every tool at your disposal.
It’s never been easier to set expectations with clients, prove your fiduciary care, and grow your business.
 Nitrogen Elite